
The power supply is an important part of electronic and electrical equipment, and the battery is an indispensable power supply component in mobile electronic products. The power supply or battery module in the electronic product directly affects the working condition of the electronic product. For mobile electronics, electrical products, large industrial equipment, such as electric vehicles, mining equipment, medium to home electric motorcycles, as small as mobile phones, Ipad and other handheld devices, all related to battery equipment, battery performance for electronics, electrical equipment Performance plays a decisive role. The performance indicators of the battery include: battery capacity, energy ratio, load characteristics, life and many other parameters, and the evaluation of battery performance is generally obtained by measuring the internal resistance parameter of the battery, because the internal resistance of the battery directly affects the load capacity of the battery. It is also the basis for indirect evaluation of battery performance.
At present, common methods for measuring internal resistance of batteries at home and abroad include density measurement, open circuit voltage method, DC discharge method and AC injection method. The above method is suitable for small-capacity battery or laboratory measurement. For large-capacity or ultra-large-capacity battery measurement, there are fatal problems such as poor measurement accuracy, heat generation, and fragile battery. It is an urgent problem to be solved in industrial applications, and large-capacity battery performance measurement. It is difficult to accurately measure by DC discharge method.
In laboratory precision measurement experiments, the principle of potential difference is often used to measure the internal resistance of precision meter or small-capacity battery. The measurement accuracy of this principle depends on the accuracy of the measuring instrument, the measuring method, the internal resistance of the measured object, the measuring process, and
The internal resistance is equivalent to a series connection resistance and other factors. For example, a small-capacity laminated battery has a large internal resistance and has no special requirements for the measurement process. With the principle of potential difference, high measurement accuracy can be obtained without adversely affecting the power supply, but the principle cannot be used. The internal resistance of large-capacity batteries is measured by: 1) long-term (second-order) high-current discharge and vulnerable batteries; 2) line resistance seriously affects measurement accuracy.
According to the problems of the above measurement principle, based on the principle of open circuit voltage method and DC discharge method, the battery internal resistance test equipment based on the principle of position difference and CORTEX-M3 microprocessor is designed, which measures the no-load voltage Ue and load of the battery respectively. The voltage UL, using the measurement parameters Ue, UL and the known load resistance RL, indirectly measures the battery internal resistance Ri by calculation. The advantages are: 1) no need for large current discharge, avoiding battery and contact heating phenomenon; 2) instant (micro Second level) Discharge and rapid measurement, non-destructive battery; 3) Line resistance is independent of measurement results, and measurement accuracy is extremely high. This principle has been verified in industrial inspection applications.
1 Measuring principle
1.1 Measuring circuit
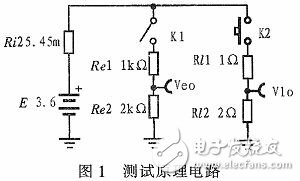
Taking into account the level requirements of the Cortex-M3 microprocessor (STM32F103) data acquisition and the convenience of the principle verification test, a large-capacity lithium battery with a nominal 3.6 V and a voltage divider circuit are used as test circuits, as shown in Figure 1.
1. 2 component role and parameter selection
E: equivalent ideal voltage source, parameter to be measured; Ri: series internal resistance of the battery, the parameter to be measured;
Load measurement branch: including K2 switch and voltage dividing resistors Rl1, Rl2. Rl1 and R2 form a load divider, and the resistance parameter selection should meet the level requirements of the data acquisition port and the requirements of heavy load discharge. This branch selects R1=1 Ω, R2= 2Ω.
No-load measurement branch: including switch K1 and voltage dividing resistors Re1, Re2. Re1 and Re2 form a no-load voltage divider, and the partial pressure is RL branch, but the parameter selection should be much larger than the RL branch, so as not to affect the measurement accuracy of the no-load voltage. This branch selects R1=1 kΩ, R2=2 kΩ, the voltage division ratio is the same, and the branch currents differ by 1 000 times, which satisfies the above measurement conditions.
UE0, UL0: are the no-load and load voltage measurement terminals respectively. Using the measured data, the battery terminal voltage U0 of the no-load and load state of the battery is calculated and indirectly measured, and the internal resistance Ri of the power source is indirectly measured according to the bit difference.
K1 and K2 are electronic switches for measurement control, and their on-resistance is only about 12 mΩ, which can ignore the influence on the circuit.
1.3 Measurement principle
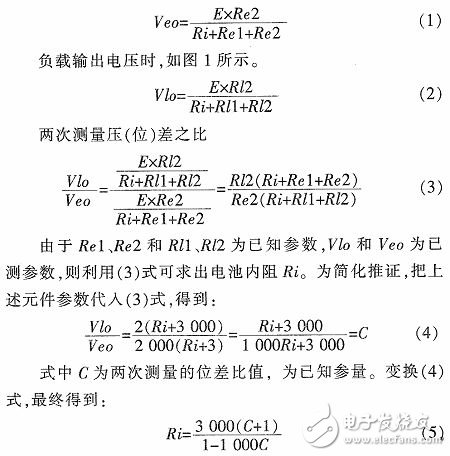
In the circuit of Figure 1, the operation of the two branches is controlled by the K1 and K2 electronic switches, respectively, and is not synchronized. When measuring no-load voltage, disconnect K2 and close K1. According to the principle of resistance division, the output of the no-load partial voltage is:
2 simulation test
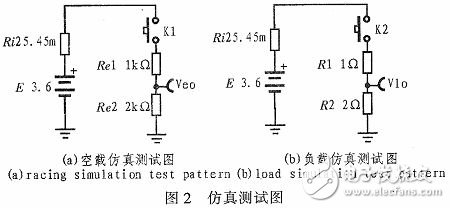
The above formula is simulated and verified by circuit simulation software. In the simulation test: the simulation software is TINA V8.0 industrial version; the no-load test branch parameter selection: (Re1+Re2)》(Rl1+Rl2); the internal resistance Ri: variable parameter test verification; simulation test circuit: reference diagram 1.
2.1 Simulation test circuit
Turn on and off the K1 and K2 test switches in the circuit of Figure 1, respectively, then the equivalent circuit of the no-load voltage and load voltage simulation test is shown in Figure 2. Figure 2 (a) shows the no-load simulation test chart, Figure 2 ( b) indicates the load simulation test chart.
2.2 Simulation test verification
According to the above parameter selection principle, the component parameters shown in Fig. 2 are selected, and the simulation measurement values ​​and error analysis of different Ri are calculated by formula (5), as shown in Table 1.
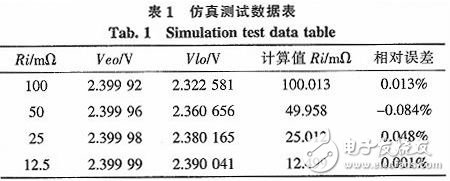
The test results in Table 1 verify that the principle of measuring the internal resistance of the power supply or the battery using the principle of the difference is correct and has extremely high precision.
3 hardware design
The actual test system is based on the Cortex-M3 architecture 32-bit microprocessor, using on-chip self-calibration, high-speed, high-performance 12-bit ADC data acquisition module, and using time-sharing logic control principle to achieve no-load voltage and load
Voltage testing to eliminate problems such as battery heating and damage caused by the measurement process.
The test system structure diagram and schematic diagram are shown in Figure 3.
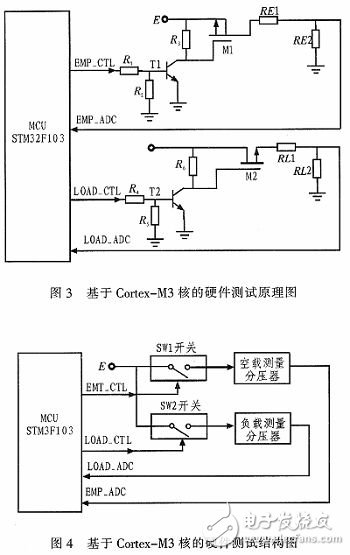
Circuit diagram description: R1 ~ R3, T1, M1 - no-load measurement control switch. R4 ~ R6, T2, M2 - load measurement control switch. The functions and functions of other components are the same as before.
4 software design
In practical applications, only measuring static internal resistance (ie, single-point measurement) can meet the requirements of general industrial applications, but in battery or power performance research applications, it is also required to track the power supply characteristics, that is, the dynamic performance measurement of the internal resistance of the power supply. this
The system is designed with static internal resistance and dynamic internal resistance measurement. As shown in Figure 5 and Figure 6.
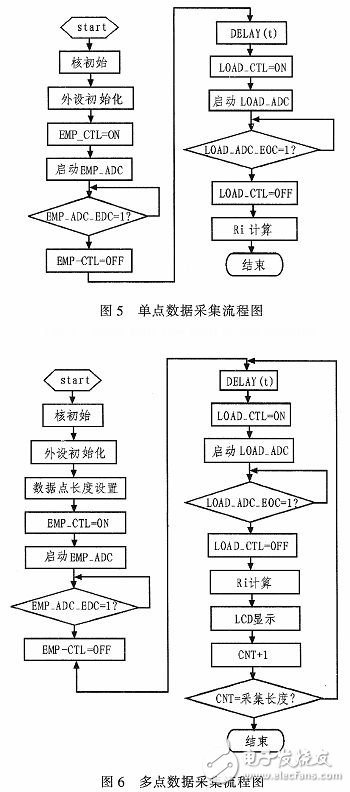
Figure 5 shows a static (single-point) data acquisition flow chart, static (single-point) test logic is based on single-point data acquisition. Figure 6 shows a dynamic (multi-point) data acquisition flow chart. Dynamic monitoring requires continuous curve output for precise, intuitive measurements.
5 test results
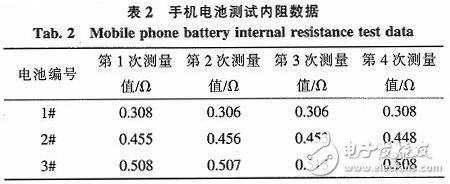
5.1 Load single point measurement data
The table below lists the internal resistance data for the three inefficient mobile phone batteries, single point, repeat (4 times) test.
5.2 Dynamic internal resistance test display
The battery voltage, current and internal resistance change curve under continuous heavy load conditions can display its charging current, voltage, temperature, etc. in real time. The display effect is good, and the user can know the current state of the battery in real time, which is convenient for users.
6 Conclusion
Based on the principle of potential difference and the application of the internal resistance detection system controlled by Cortext-M3 nuclear microprocessor, the practice shows that the test principle is correct and the result is accurate. It is applied to the project and fully meets the application requirements in precision detection and industrial testing equipment. have a broad vision of application.
Led Guardrail Light barrier lights on the LED light source, there are red,yellow,green,blue,white,purple,green or colorful color, such as by microchip control, which can realize the gradient, jump, color flashing, random, alternating gradient, chase, scan flow such as color change.
It is especially suitable for the application of the billboard background, overpass bridge, river, lake guardrail, building outline and other large dynamic light belts, which can produce a rainbow gorgeous effect.The outline of the building is decorated with a guardrail, which can accentuate the effect of beautifying buildings.It has turned out to be one of the best lighting products in the world.

Product size


Description of products
1.The lamp uses radiant heat dissipation structure design, can let lamps and lanterns have better heat dissipation effect.
2.Meet the protection requirement of IP65, pass national lamps and lanterns quality detection center detection.
3.High strength tempered glass, transparent and uniform.
4.Adopt ACC12 die casting aluminum and surface is processed by process
5.The high purity acrylic optical lens improves the luminous efficiency and ensures the output of luminous flux.
6.The luminaire implements 256 gray scale, 16.7 million R/G/B synthetic color changes.
Led Guardrail Light,Led Wall Washer Light Fixtures,Led Wall Washer Flood Light ,Led Wall Washer Light Products
Jiangsu chengxu Electric Group Co., Ltd , https://www.chengxulighting.com